AnnaHollander.github.io
Project maintained by AnnaHollander Hosted on GitHub Pages — Theme by mattgraham
Anna Hollander
"Without music, life would be a mistake."- Friedrich Nietzsche
Hi! My name is Anna Hollander. I am a senior at Lehigh University majoring in Journalism and Communications, with double minor in Music and Music Industry. My coursework has included data journalism and visualization, as well as courses in music marketing, production, and theory and writing for media. During my academic career, I learned how to tell powerful and effective stories in a creative and interdisciplainary way. Here is a sampling of the different types of Data Visualizations that I have created. I hope you enjoy them!
Comic Strip
Here is a comic strip I made using the program 'pixton.' to better tell you a little bit about myself.
Timeline
"That's one of the great things about music. You can sing a song to 85,000 people and they'll sing back for 85,000 different reasons." -Dave Grohl
I grew up in a family that lives and breathes Bruce Springsteen. I knew how to sing Born To Run before I could tie my own shoes. One of the most powerful qualities of music is its ability to speak out against injustice and bring people together during times of turmoil. I wanted to show how music is a reaction to what is happening in the world by showing political conflict based on the topic of Bruce Springsteen's songs. I decided to visually represent this unique quality of music through a timeline which was made using TimelineJS.
Time Series Chart
“Music is forever; music should grow and mature with you, following you right on up until you die.” -Paul Simon
As someone who is always keeping up with new music, I wanted to see how popular music preferences have changed over an extended period. I created a line chart using chartbuilder to show how the popularity of different genres have changed in the U.S. over the past 10 years.
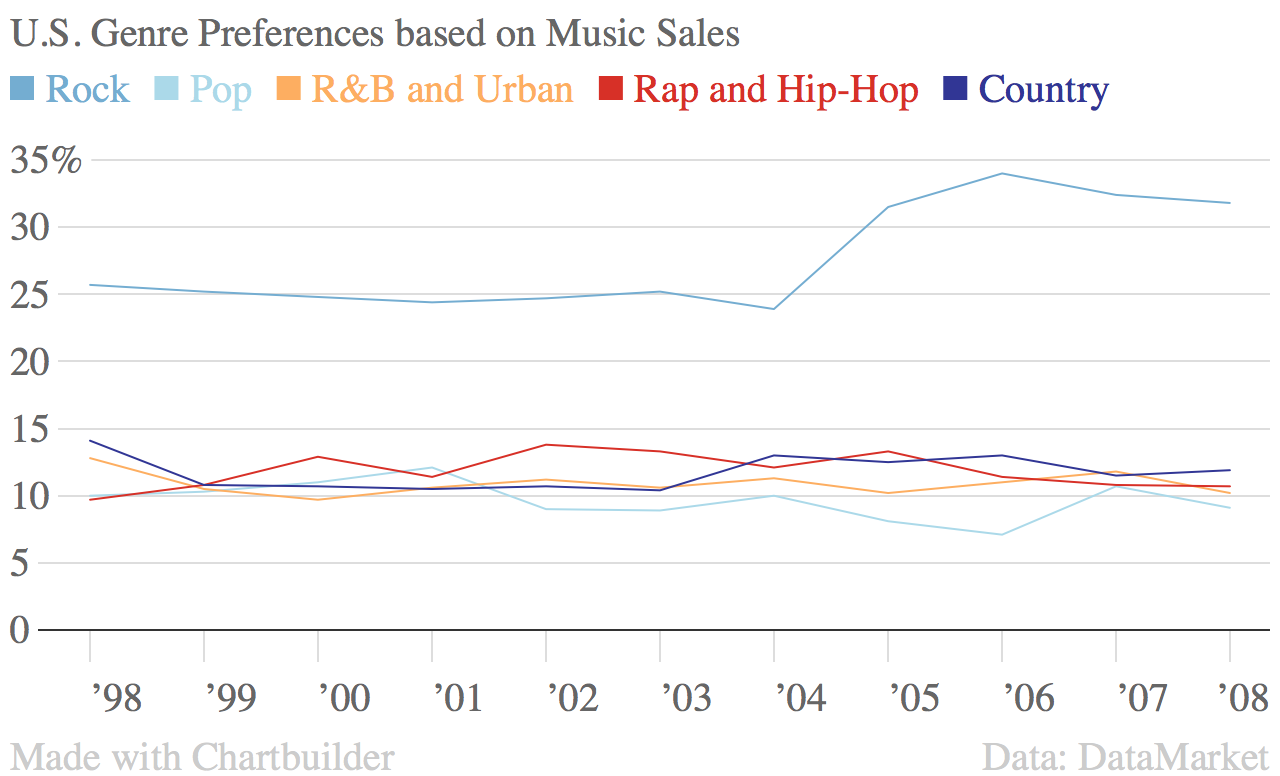 U.S. Genre Preferences based on Music Sales
Google Fusion Map
“Well, everybody faces the fact there really aren’t many record stores around to just go and browse. Maybe browse online, yet that tactile feel of flipping though a stack of vinyl remains one of life’s simple pleasures.” - Billy Gibbons
Listening to vinyl is like listening to music in its most lively and natural form. One of my favorite ways to spend free time is hidden in the record stores scattered around the lower east side. There is nothing as incredible as the experience of discovering music while sifting through crates of unknown albums and artists. I decided to make a map using Google Fusion to make it easy for everyone to get lost in the bins of albums.
Interactive Map
"Music is a world within itself; it is a language we all understand." -Stevie Wonder
There is nothing like a music festival. It is a place where everyone gets to hang out and enjoy their favorite music all day. Festivals promote diversity and bring people together through the magic of live music. In order to show that music is truly a universal language, I decided to pick the top music festivals from 2016 based on location. I created this interactive map using Tableau.
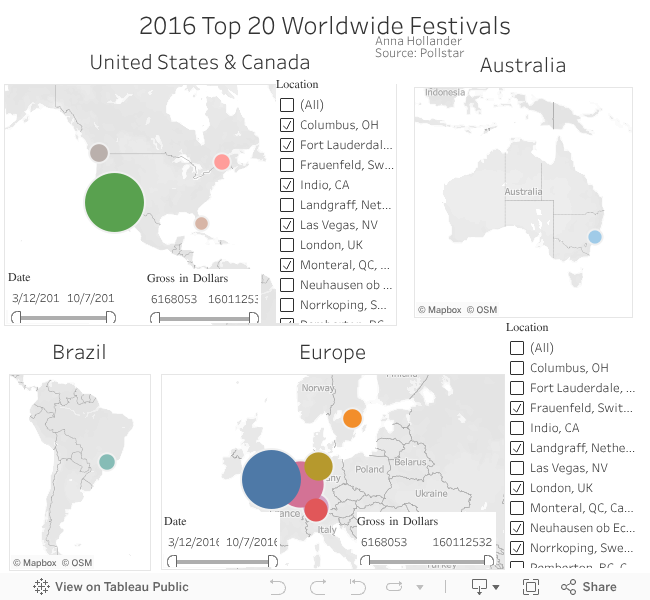
Top Gross Music Festivals in 2016
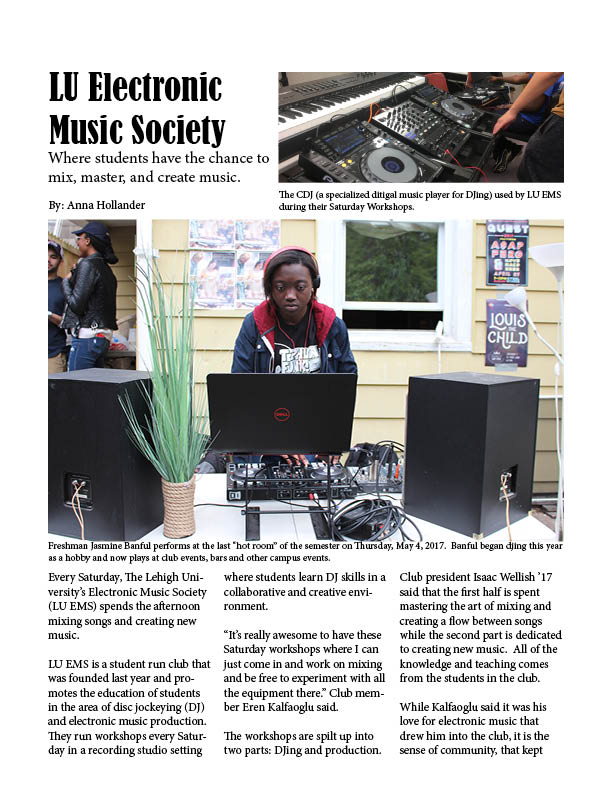
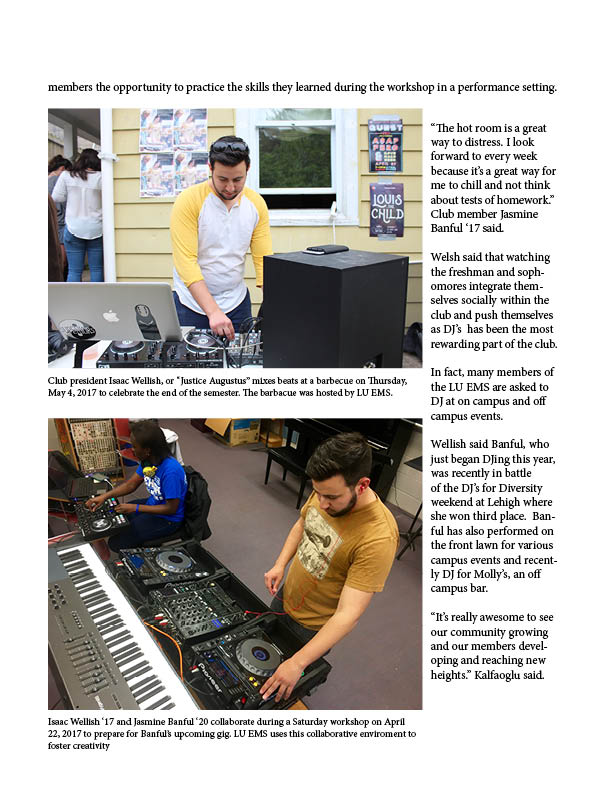
Magazine Spread
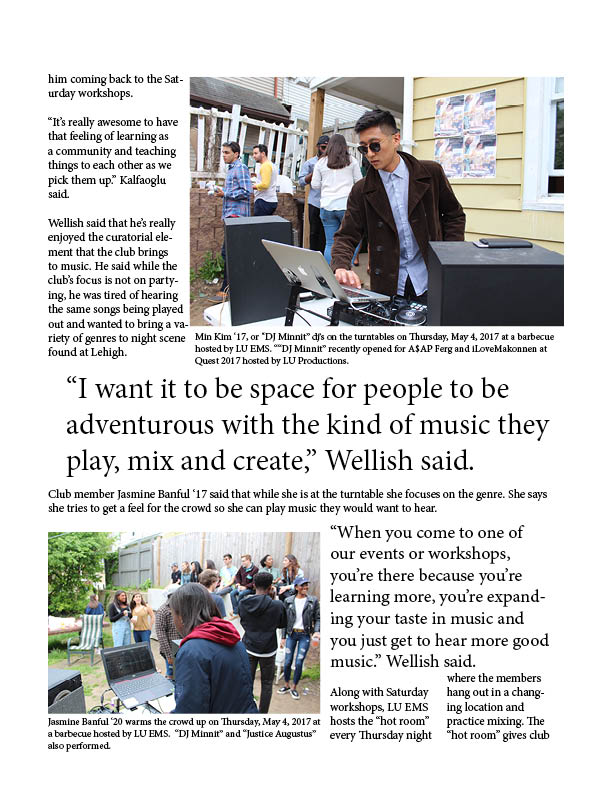
Here is a magazine spread I created for the LU Electronic Music Society using InDesign.
Video Project
Here is an accompanying video I made for the LU Electronic Music Society using Final Cut Pro.
Check it out! LU Electronic Music Society Video
Infographic
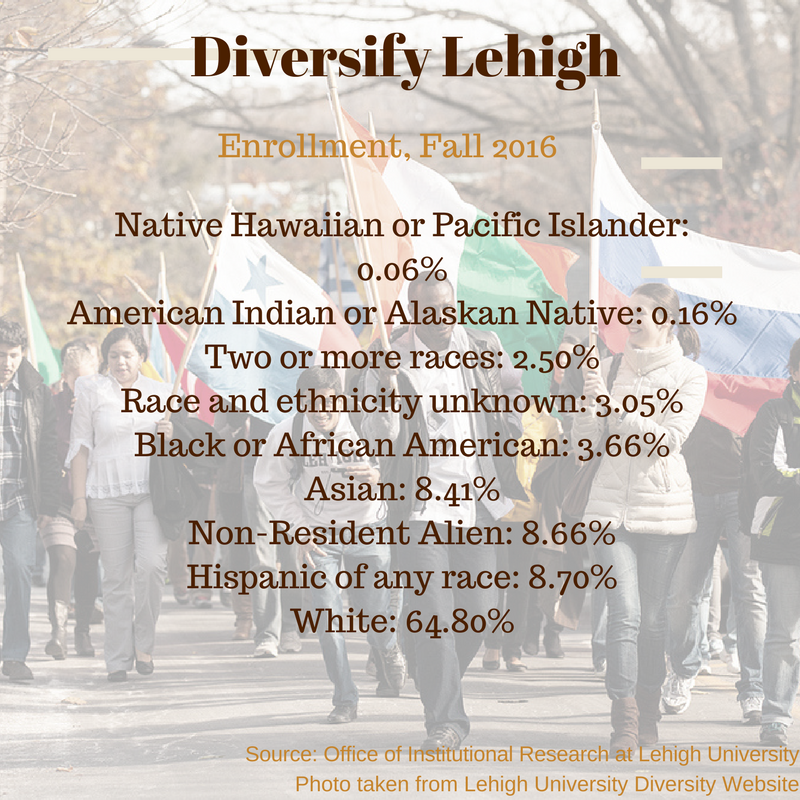
"Ethnic diversity adds richness to a society."- Gary Locke
As a student at Lehigh University who lived in a big city with incredible diversity, I wanted to see how diverse Lehigh is. I created an infographic using Canva to demonstrate the breakdown of races on campus.
Read my other work!
Music Blog University Published Articles More Published WorkContact Me!
Email: aph218@lehigh.edu
Connect with me on LinkedIn